
Angul district in Odisha is richly endowed with several minerals. A number of companies like NTPC, Jindal, Bhushan Steel etc have established large industrial complexes in the district to take advantage of this rich heritage. However, these industrial units are also responsible for the rising levels of pollution esp. air pollution in the district. The plants blow out thick black smoke throughout the day which contains a large number of heavy metals and other toxins which can be dangerous to the surrounding population.
Environics Trust, New Delhi is currently engaged in installing Air Pollution monitoring devices in different parts of the country to highlight this issue of increasing air pollution by these industries and mines. As part of this initiative, in collaboration with Nari Surakshya Samiti, a 3 member team visited Angul in the month of March 2018 to install 10 Air monitoring devices in different parts of the district. NSS helped to identify the most vulnerable spots in the district where the instruments could be placed.
The device measure the Particulate Matter in sizes of 2.5 (PM 2.5) and 10 (PM 10) micron. These fine particles can easily enter into the human body through inhalation and can get deposited in the lungs. Over a period of time, irreparable damage occurs in the lungs and lead to severe respiratory disorder. Moreover, the dust particles form a thick layer on physical and liquid materials that make them dirty and unhealthy.
Below is the table which contains the location of the devices and a brief summary of air monitoring results. The results are for the period between 10 March and 24 March 2018.
| Location | PM2.5 | PM10 | AQI | ||||||
| Avg | Max | Min | Avg | Max | Min | Avg | Max | Min | |
| NSS Office,Angul | 97.73 | 296.00 | 19.00 | 184.97 | 502.00 | 51.00 | 208.22 | 490.00 | 51.00 |
| Gandhi Nagar | 139.55 | 485.00 | 36.00 | 233.89 | 751.00 | 68.00 | 286.60 | 801.25 | 76.00 |
| Kalamchhuin | 124.63 | 634.00 | 25.00 | 254.92 | 839.00 | 72.00 | 277.26 | 911.25 | 72.00 |
| Kumunda | 109.35 | 312.00 | 26.00 | 199.83 | 431.00 | 64.00 | 237.09 | 447.69 | 67.00 |
| Derange 1 | 103.51 | 407.00 | 1.00 | 209.64 | 569.00 | 1.00 | 229.43 | 573.75 | 1.67 |
| Derange 2 | 115.26 | 333.00 | 24.00 | 202.67 | 382.00 | 54.00 | 246.38 | 463.85 | 54.00 |
| Ramadiha | 118.41 | 561.00 | 19.00 | 199.79 | 710.00 | 43.00 | 245.25 | 750.00 | 46.67 |
| chhendipada | 100.48 | 366.00 | 17.00 | 179.74 | 427.00 | 36.00 | 216.83 | 489.23 | 36.00 |
| Ghantianali | 97.26 | 207.00 | 23.00 | 181.42 | 288.00 | 57.00 | 215.81 | 366.92 | 59.00 |
| Kakudia | 115.90 | 412.00 | 29.00 | 181.39 | 645.00 | 54.00 | 244.17 | 668.75 | 57.00 |
****As per National Ambient Air Quality Standards issued by CPCB the PM 10 in Residential areas should not be more than 60 µg/m3 (Annually average) and 100 µg/m3 (hourly average) and PM 2.5 should be 40 µg/m3 (annual average) and 60 µg/m3 (hourly average).
Here is a brief analysis of data at different places.
- As per the data available, the values of PM 2.5 and PM 10 are both exceeding the standards prescribed by the CPCB.
- The Average value of PM 2.5 is 139.55 µg that is maximum at Gandhi Nagar.
- From the above data the average, maximum and minimum value of PM 10 is having the highest value at Kalamchhuin.
- At Gandhi Nagar average of AQI is having the highest value. This is because the value of PM2.5 and PM10 is maximum most of the time.
- The average value of PM2.5 at Derange 2 is greater than Derange 1 but the value of PM10 at Derange 1 is greater than Derange 2.This is possible because the Particulate Matter of 10 micron is present more than the size of 2.5 micron at Derange 2.
- The minimum value of PM2.5 is 1.00 µg at Derange 1.
- At Gandhi Nagar the minimum value of AQI is 76.00 µg .
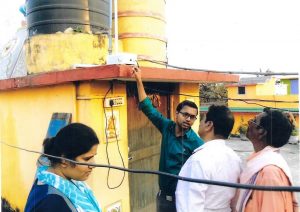
Installation of Air Quality Index Devices at Derange village
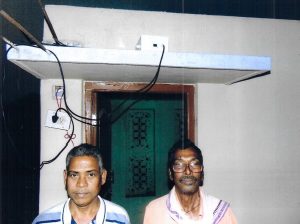
Installation of Air Quality Index Devices at Ghantianali village
The team also visited several affected villages and had extensive discussion with communities on the issues of air pollution and helped them to understand the air monitoring devices and how to understand the data.
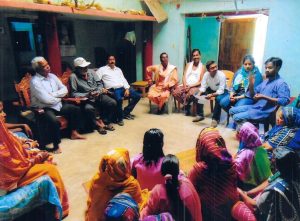
Extensive discussion with communities on ongoing issues (Derange village)
Recent Comments