
Air Pollution in the country has been deteriorating to dangerous levels over the past few years, mainly due to the increased pace of mining, industrial activity, construction activity, vehicular emissions, etc. The air quality in NCR and surrounding regions, has been especially making headlines due to the levels breaching the severe category regularly.
However, several regions in the country especially the coal mine areas have air quality even worse than Delhi but do not figure in the news either because the air pollution levels are not measured in these places or because the data is manipulated so as not to cause alarm. The monitoring stations installed by the companies are either non-functional or have been manipulated to ensure that the readings are all within legal limits. However, these legal readings fail to disclose the cumulative impact of a large number of mines/industries in a small city like Angul or Korba where multiple industries are located and all routinely report pollution levels within limits.
Environics Trust has installed 97 low cost Air pollution monitor devices in multiple locations in the states of Chhattisgarh, Jharkhand, Odisha, Delhi, West Bengal and Uttar Pradesh to evaluate the pollution levels in several highly industrialised areas.
Analysis of the Monitoring Data
- There are 720 hourly intervals starting from 1 Sep (1 AM) to 30 Sep (Midnight), 4 devices worked for all the intervals and another 3 worked for more than 700 intervals.
- The air quality measured by the devices placed at Petrol Pump, TP Nagar, Korba and Ramadih, Angul have recorded AQI >100 for all intervals. The dust sensor for these devices need to be calibrated as the readings are recorded as maximum for all intervals.
- The device placed at Ashok Nagar, Moradabad, Uttar Pradesh has recorded the poorest Air Quality index where in 89% of the readings had AQI > 100
- Another 4 devices had AQI > 100 for more than 80% of the intervals. It is noticed that three (3) devices in Korba have recorded very poor air quality. This is despite the prevailing monsoon season and regular rainfall in the month of September 2018. (Table 1 Below)
| Device Number | Location | No of intervals | Intervals – AQI >100 | %age AQI >100 |
| 1212170176 | Bargadwa Gorakhpur, Uttar Pradesh | 563 | 469 | 83.30% |
| 1201180019 | Darri, Korba | 562 | 473 | 84.16% |
| 1201180030 | TP Nagar, Korba | 547 | 468 | 85.56% |
| 1201180068 | SS Green, Korba | 410 | 329 | 80.24% |
- Four (4) devices have reported AQI more than 100 for 0 intervals
- Kumunda Angul (567 intervals)
- Ghantianali Angul (132 intervals)
- Kusmunda Korba (512 intervals)
- Baraut, Uttar Pradesh (334 intervals)
The dust sensor for these devices may require re-calibration as the values reported are very low and not corresponding to the high values measured by other devices placed in vicinity.
- Three (3) devices have reported AQI >100 of less than 20% of the intervals
- 1201180141 Korba (64 intervals out of 369; 17.34%)
- 1211170030 New Delhi (16 intervals out of 144; 11.11%)
- 1211170021 Kolkata (25 intervals out of 144; 17.36%)
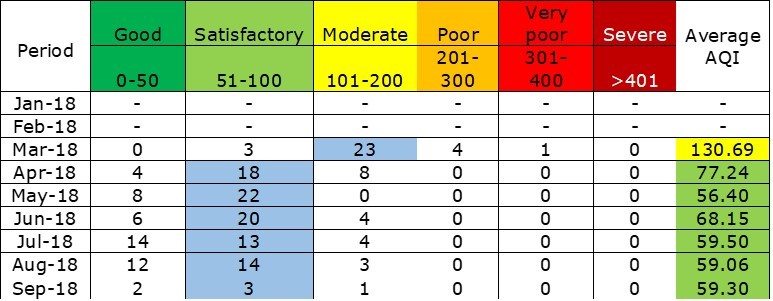
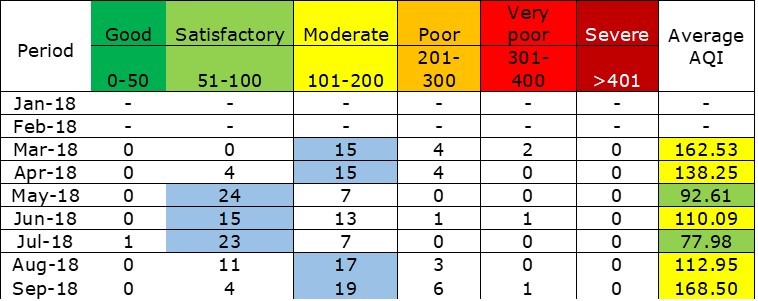
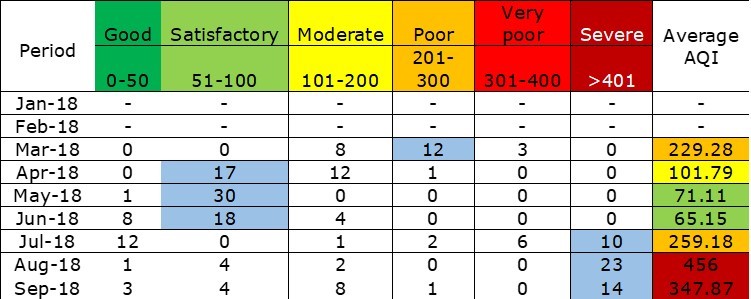
Monthly Average AQI Values
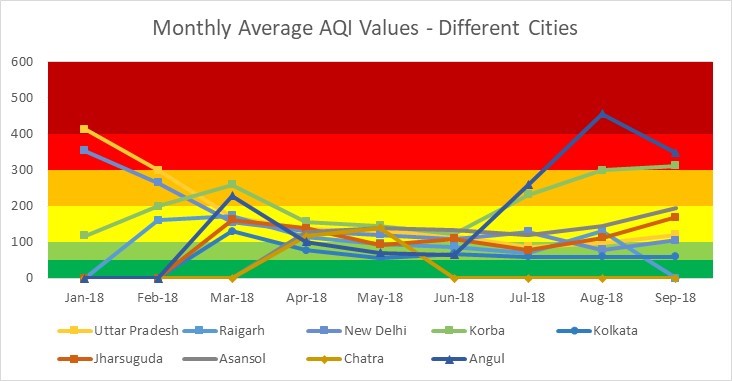
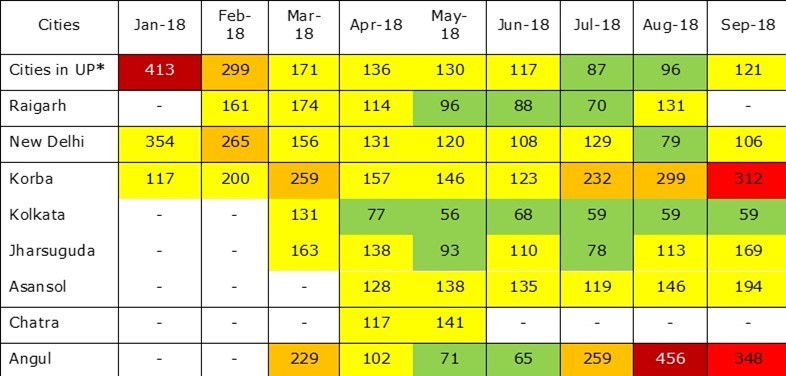
The graph below shows the Monthly Average Air Quality Index (AQI) values for different cities. The Average values have been calculated for all the device placed in the city and for Uttar Pradesh all the devices placed in the state.
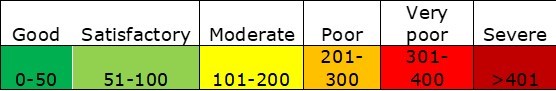
As per the National Air Quality Index, the quality of air has been broken into different segments based on the AQI values.
- As per the graph and data, Angul remains the most polluted city. However, the air quality has improved from Severe to Very Poor category
- Korba Comes a close second and the air quality has deteriorated from Poor to Very Poor
- Kolkata remains the cleanest city with the air quality remaining in the Satisfactory category
- Air Quality for other cities was in the Moderate category
* Allahabad, Ambedkar Nagar, Amethi, Azamgarh, Bagpath, Bhadohi, Balia, Basti, Chandauli, Chitrakoot, Faizabad, Ghazipur, Gorakhpur, Gonda, Hamirpur, Jalaun, Jaunpur, Jhansi, Kanpur, Kaushambi, Maharazganj, Mau, Meerut, Mirzapur, Moradabad, Muzaffarnagar, Pratapgarh, Robertsganj, Saharanpur, Sonbhadra, and Varanasi
An important aspect to notice is that other than Angul for which AQI improved and for Kolkata where it remained same, for all other cities, the Air quality has deteriorated. This is a serious matter and with the ending of the monsoon season, the quality can be expected to only get poorer. Festive season and lowering of temperature with the advent of winter may add to the increasing air pollution.
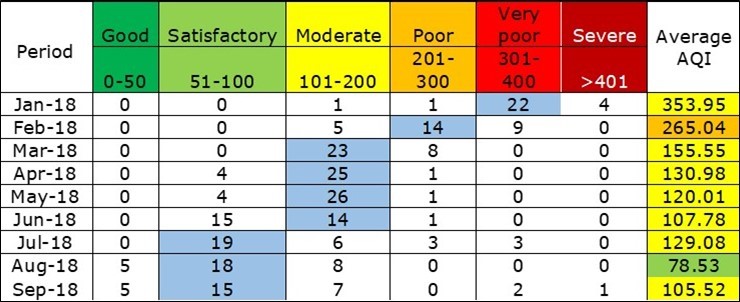
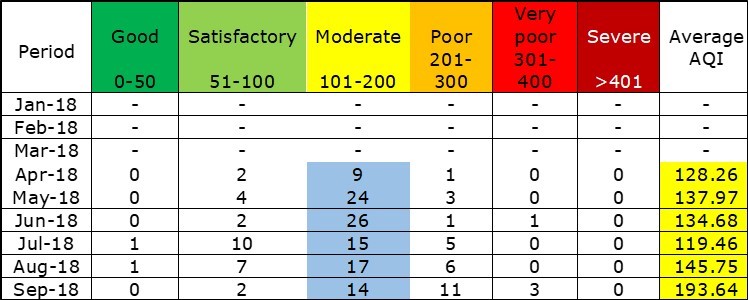
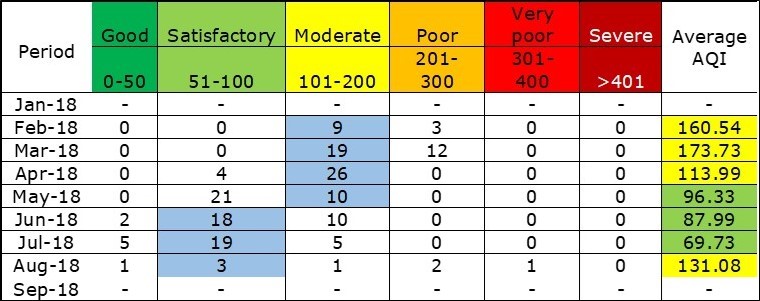
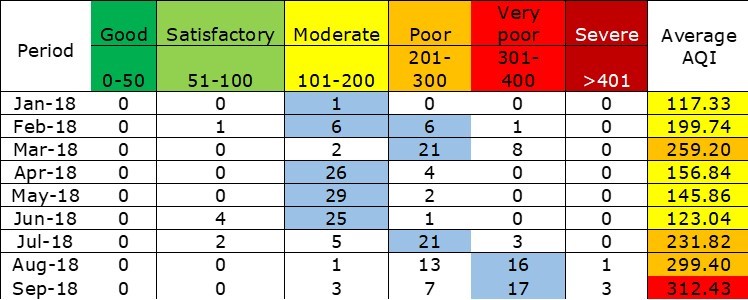
Monthly AQI Values
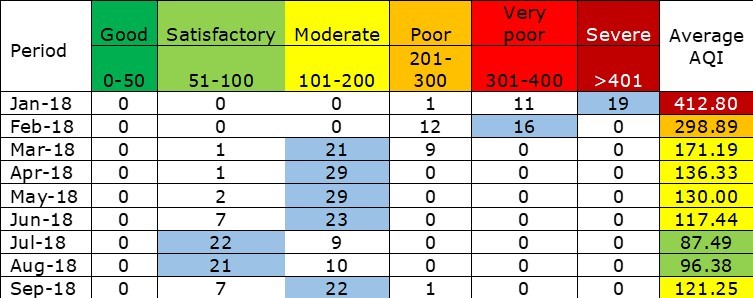
Another important aspect to consider is the category of air quality for different days in the month.
The below tables, compiled city wise, shows the AQI quality for a City between different AQI categories. For UP, the data is shown for the entire state. The values show the number of days the air quality was reported in the respective category in the month. The average AQI value shows the monthly Air Quality level for the respective grouping.
The tables clearly show a trend of deteriorating Air Quality for more number of days recording Poor air quality as compared to previous months.
Uttar Pradesh
New Delhi
Asansol
Raigarh
Korba
Kolkata
Jharsuguda
Angul
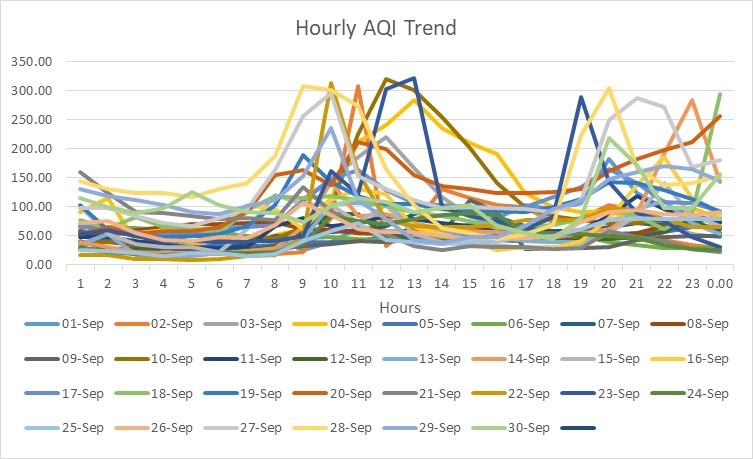
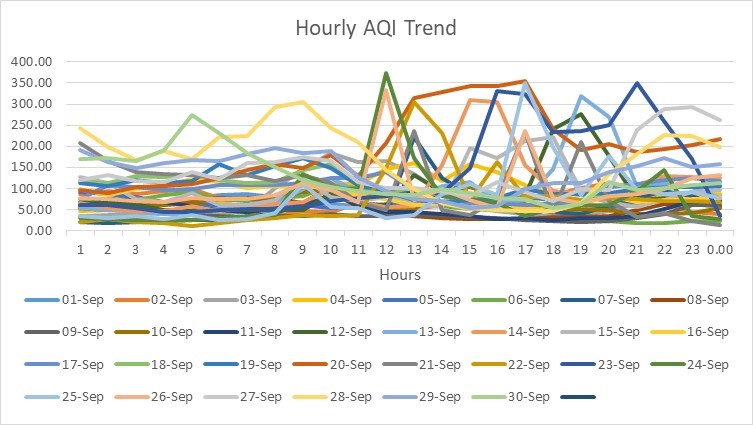
Analysis / Graph of some devices (Daily hourly AQI) – Devices which worked for all intervals
Graph for Device Number 1201180043 placed at Neb Sarai, New Delhi
| PM 2.5 | PM 10 | AQI | Entries AQI >100 | AQI >100 | ||||||
| Avg | Max | Min | Avg | Max | Min | Avg | Max | Min | ||
| 41.45 | 148.50 | 5.00 | 75.05 | 262.50 | 8.50 | 80.50 | 321.92 | 8.50 | 174 | 24.17% |
- The device shows comparatively low readings early in the morning. The dust levels start rising in the morning around 7-8 AM and then remain high till noon
- The levels start going down in the afternoon and till about 5 PM dust levels are under control
- Around 5-6 PM, the dust levels start rising again and remain high usually till about 10-11 PM
- The overall quality of air is Satisfactory with only 24% of the intervals recording an AQI > 100
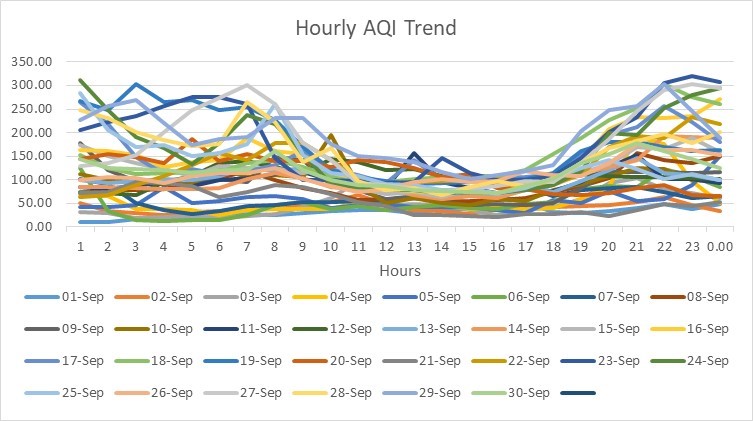
Graph for Device Number 1201180043 placed at Neb Sarai, New Delhi
| PM 2.5 | PM 10 | AQI | Entries AQI >100 | AQI >100 | ||||||
| Avg | Max | Min | Avg | Max | Min | Avg | Max | Min | ||
| 43.15 | 215.00 | 5.00 | 91.83 | 318.00 | 12.00 | 95.30 | 373.08 | 12.00 | 236 | 32.78% |
- The device shows comparatively low readings early in the morning. The dust levels start rising in the morning around 9-10 AM
- The device is kept indoors and the indoor pollution has been generally noticed to be higher than the environmental pollution.
- The overall quality of air is Satisfactory with only 32% of the intervals recording an AQI > 100
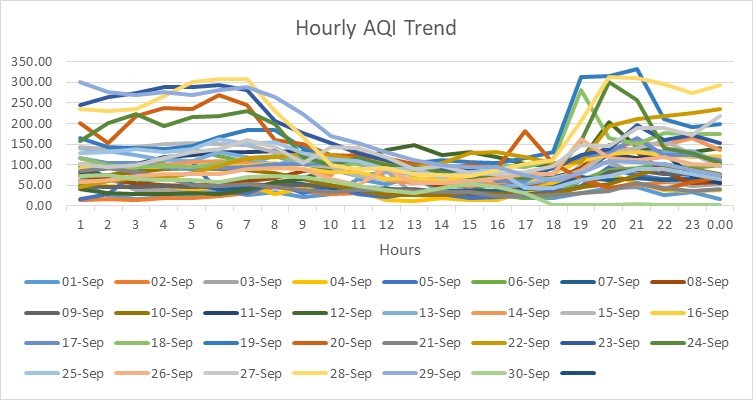
Graph for Device Number 1211170146 placed at Adarsh Nagar, Mahmoorganj
| PM 2.5 | PM 10 | AQI | Entries AQI >100 | AQI >100 | ||||||
| Avg | Max | Min | Avg | Max | Min | Avg | Max | Min | ||
| 55.12 | 144.50 | 3.50 | 104.62 | 258.00 | 10.00 | 111.61 | 318.85 | 10.00 | 345 | 47.92% |
- The device records high readings in the early morning phase till about 10 AM.
- The dust levels start dropping around 10 AM and remain low till 6 PM
- The levels again start rising at 6 PM and remain high throughout the night
- The device may be placed in an industrial area which witnesses high commercial vehicular traffic in the night or some industrial activity where in the dust suppressing mechanisms have been shut in the night
- The overall quality of air is Poor with 47% of the intervals recording an AQI > 100
Graph for Device Number 1211170147 placed at Nandan Kutir Balipur, Uttar Pradesh
| PM 2.5 | PM 10 | AQI | Entries AQI >100 | AQI >100 | ||||||
| Avg | Max | Min | Avg | Max | Min | Avg | Max | Min | ||
| 49.55 | 162.00 | 0.50 | 86.60 | 272.50 | 1.00 | 96.59 | 332.31 | 1.00 | 276 | 38.33% |
- The device records high readings in the early morning phase till about 9 AM.
- The dust levels start dropping around 10 AM and remain low till 6 PM
- The levels again start rising at 6 PM and remain high throughout the night
- The device may be placed in an industrial area which witnesses high commercial vehicular traffic in the night or some industrial activity where in the dust suppressing mechanisms have been shut in the night
- The overall quality of air is Poor with only 38% of the intervals recording an AQI > 100
Summing up, the above analysis strongly emphasize the acute need to strictly implement existing provisions of pollution monitoring norms, as prescribed under law. It acquires greater significance than commonly assumed as it adversely affect the health and well-being of workers, their families and population living in close vicinity, on the one hand, while also deteriorating quality of environment and ecology, on the other hand. Given the international commitments by our country, regarding climate change and SDGs, it becomes mandatory to minimize such pollution levels.
Author – Mohit Gupta
Recent Comments