
Air pollution has emerged as a major global problem in developing and developed countries, both. In India, the situation has grown far worse in recent times due to various factors – agricultural activities, burning of fossil fuels, mining operation, indoor activities, dust, demolition in the construction industry, forest fires, etc. The visible and measurable impacts of air pollution is at two levels – global atmosphere and human beings. The manifestations of global impacts are reflected in climate changes, acid rain, and ozone layer depletion whereas its ill-effects on human beings are seen in the form of increased air-pollution related deaths (respiratory diseases, heart ailments, cancer, etc.).
The then Minister for Environment, Forests & Climate Change launched the National Air Quality Index (NAQI) in 2014 under ‘Swachh Bharat Abhiyan.’ It is outlined as ‘One Number-One Color-One Description’ for the common man to judge the air quality within his vicinity (table 1).
Table 1 – Air Quality Indices (AQI) in India
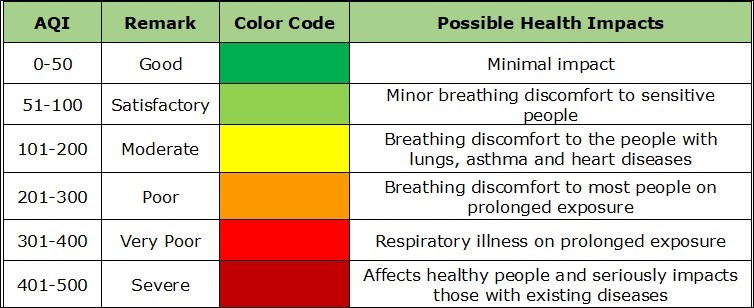
Source: Central Pollution Control Board, 18 November 2009
Note: Values above 500 are not considered in computation of AQI
Each category corresponds to a different level of health concern:
- Good. The AQI value for your community is between 0 and 50. Air quality is satisfactory and poses little or no health risk.
- Satisfactory. The AQI is between 51 and 100. Air quality is acceptable; however, pollution in this range may pose a moderate health concern for a very small number of individuals. People who are unusually sensitive to ozone or particle pollution may experience respiratory symptoms.
- Moderate. When AQI values are between 101 and 200, members of sensitive groups may experience health effects, but the general public is unlikely to be affected.
- Ozone: People with lung disease, children, older adults, and people who are active outdoors are considered sensitive and therefore at greater risk.
- Particle pollution: People with heart or lung disease, older adults, and children are considered sensitive and therefore at greater risk.
- Poor. Everyone may begin to experience health effects when AQI values are between 151 and 200. Members of sensitive groups may experience more serious health effects.
- Very Poor. AQI values between 201 and 300 trigger a health alert, meaning everyone may experience more serious health effects.
- Severe. AQI values over 300 trigger health warnings of emergency conditions. The entire population is even more likely to be affected by serious health effects.
For the sake of comparison, AQI in eight cities in two different states of India and in Delhi, is shown in tables 2 and 3.
Table 2 – AQI in three cities of three states
| S.N. | State | City | Station Name | Current AQI value |
| 1 | Andhra Pradesh | Amaravati | Secretariat, Amaravati – APPCB | 214 |
| 2 | Rajamahendravaram | Anand Kala Kshetram, Rajamahendravaram – APPCB | 237 | |
| 3 | Tirupati | Tirumala, Tirupati – APPCB | 065 | |
| 4 | Vijayawada | PWD Grounds, Vijayawada – APPCB | 071 | |
| 5 | Visakhapatnam | GVM Corporation, Visakhapatnam – APPCB | 237 | |
| 6 | Bihar | Gaya | Collectorate, Gaya – BSPCB | 313 |
| 7 | Muzaffarpur | Muzaffarpur Collectorate, Muzaffarpur – BSPCB | 420 | |
| 8 | Patna | IGSC Planetarium Complex, Patna – BSPCB | 405 |
Source: Central Pollution Control Board, 7 December 2018, Time: 15:00:00
Table 3 – AQI in Delhi
| S.N. | State | City | Station Name | Current AQI value |
| 1 | Delhi | Mundka, Delhi – DPCC | 397 | |
| 2 | NSIT Dwarka, New Delhi – CPCB | 191 | ||
| 3 | Najafgarh, Delhi – DPCC | 324 | ||
| 4 | Narela, Delhi – DPCC | 346 | ||
| 5 | Nehru Nagar, Delhi – DPCC | 409 | ||
| 6 | North Campus, DU, New Delhi – IMD | 316 | ||
| 7 | Okhla Phase-2, Delhi – DPCC | 363 | ||
| 8 | Patparganj, Delhi – DPCC | 365 | ||
| 9 | Punjabi Bagh, Delhi – DPCC | 347 | ||
| 10 | Pusa, Delhi – DPCC | 348 | ||
| 11 | Pusa, New Delhi – IMD | 322 | ||
| 12 | R K Puram, New Delhi – DPCC | 368 | ||
| 13 | Rohini, Delhi – DPCC | 391 | ||
| 14 | Shadipur, New Delhi – CPCB | 327 | ||
| 15 | Sirifort, New Delhi – CPCB | 347 | ||
| 16 | Sonia Vihar, Delhi – DPCC | 362 | ||
| 17 | Sri Aurobindo Marg, Delhi – DPCC | 322 | ||
| 18 | Vivek Vihar, Delhi – DPCC | 367 | ||
Source: Central Pollution Control Board, 7 December 2018, Time: 15:00:00
The main factors behind the soaring pollution in Delhi (2) are listed below –
- National capital shares its border with the states of Haryana and Uttar Pradesh. Stubble burning by farmers in these states has often been blamed for pollution in Delhi. It is estimated that approximately 35 million tonnes of crop residue is set afire in these states.
- Vehicular emission is another crucial pollutant increasing air pollution and smog. CPCB and NEERI have declared vehicular emission as a major contributor to Delhi’s increasing air pollution.
- As the winter season sets in, dust particles and pollutants in the air become unable to move. Due to stagnant winds, these pollutants get locked in the air and affect weather conditions, resulting in smog.
- Another reason of air-pollution is over-population in the capital. Over-population only adds up to the various types of pollution, whether it is air pollution or noise pollution.
- Investing less on public infrastructure is another reason of air pollution. In India, investment in public transport and infrastructure is low which leads to congested roads, and hence air pollution.
- Large scale construction in Delhi-NCR is another culprit that is increasing dust and pollution in the air. Considering the dipping air quality, a number of construction sites have stalled work, as directed by the Delhi Government.
- Industrial pollution and garbage dumps are also increasing air pollution and building-up smog in the air.
- Despite the ban on cracker sales, firecrackers were a common sight this Diwali. It may not be the top reason for this smog, but it definitely contributed to its build up.
In last decade, waste mis-management has emerged as another critical factor increasing air pollution. The amount of untreated waste (municipal solid waste, plastic waste, domestic waste, e-waste, bio-medical waste, etc.) is hundreds of tonnes/day, most of which is dumped on the outskirts of a city, which sooner or later is put on fire.
Air is a heterogeneous mixture of various gases plus smoke, which on mixing with fog is commonly named as ‘smog.’ CPCB has identified 12 major pollutants in India contributing to air pollution in the country. As far as monitoring of AQI is concerned, Central Pollution Control Board (CPCB) is monitoring ambient air quality in 74 Tier-II cities.
Table 4 – Permissible safe limit of important pollutants in India
|
S. N. |
Pollutant (µg/m3) |
Time Weighted Average |
Concentration in Ambient Air in Industrial, Residential, Rural and Other area | Concentration in Ambient Air in Ecologically Sensitive Area |
Method of Measurement |
| 1 | Sulphur Dioxide (SO2) | Annual
24 hours |
50
80 |
20
80 |
-Improved West & Gaoke -Ultraviolet Fluorescence |
| 2 | Nitrogen Dioxide (NO2) | Annual
24 hours |
40
80 |
30
80 |
-Chemiluminescence |
| 3 | Particulate Matter(PM10) | Annual
24 hours |
60
100 |
60
100 |
-Gravimetric -TOEM -Beta attenuation |
| 4 | Particulate Matter(PM2.5) | Annual
24 hours |
40
60 |
40
60 |
-Gravimetric
-TOEM -Beta attenuation |
| 5 | Ozone(O3) | 8 hours
1 hours |
100
180 |
100
180 |
-UV photometric
-Chemiluminescence -Chemical Method |
| 6 | Lead (Pb) | Annual
24 hours |
0.50
1.00 |
0.50
1.00 |
-ED-XRF using Teflon Filter |
| 7 | Carbon Monoxide (CO) | 8 hours
1 hours |
2
4 |
2
4 |
-Non Dispersive infrared (NDIR) spectroscopy |
| 8 | Ammonia(NH3) | Annual
24 hours |
100
400 |
100
400 |
-Chemiluminescence |
|
9
|
Benzene(C6H6) | Annual | 5 | 5 | -Gas chromatography based continuous analyzer |
| 10
|
Benzo Pyrene (BaP) -Particulate phase only | Annual | 1 | 1 | -Solvent extraction followed by HPL/GC analysis |
| 11
|
Arsenic (As) | Annual | 6 | 6 | -AAS/ICP method after sampling on EPM 2000 or equivalent filter paper |
| 12
|
Nickel (Ni) | Annual | 20 | 20 | -AAS/ICP method after sampling on EPM 2000 or equivalent filter paper |
Source: Central Pollution Control Board, 2009
- 24 hourly or 8 hourly or 1 hourly monitored values, as applicable, shall be complied with 98% of time in a year. 2% of time, they have exceed the limits but not on two consecutive days of monitoring.
- Annual arithmetic mean of minimum 104 measurements in a year at a particular site taken twice a week 24 hourly at uniform interval.
- Ecologically sensitive area: is a type of designation for an agricultural area which needs special protection because of its landscape, wildlife or historical value.
More than 1 Crore registered vehicles are being operated in New Delhi. As per the Supreme Court direction, Government of Delhi should act immediately to take vehicles off the roads, if they are more than 10 years old for diesel-run vehicles and 15 years old for petrol-run vehicles. Important government offices may be shifted to some other states. Instead of keeping all central government offices in NCR, some of them must be shifted to other states.
Mitigating air pollution
Some key steps needed to mitigate air pollution can be listed, like –
- The ‘Clean Air Campaign’, air filtering buses i.e. Pariyayantra (the filters can trap up to 98% of the particulate matter) should be adopted in all the metropolitan cities.
- The manufacturing and import of traditional crackers should be banned within the country, only eco-friendly crackers should be allowed.
- Impose heavy penalty on industries not adhering to emission standards.
- Create awareness among villagers about the ill effects of the pollutants and the activities leading to air pollution.
- People in metropolitan cities are, in general, insensitive to the alarming situation of air pollution and need to be penalized heavily, if found violating the law.
- Use of CNG needs to be promoted in Tier 1 and Tier 2 for smaller cities and villages. Govt. should increase the subsidy on installing solar panels and use of other renewable sources.
- Use energy efficient devices – LED and CFL light consumes less electricity and also help to reduce air pollution by consuming less energy.
- Reduce, reuse and recycle – everyone must understand this concept of reducing, reuse and recycle to save energy and reduce pollution.
- Use public transport – Try to use public transport services to reduce pollution in the air. This will help to save your money and reduce the chances of more air pollution.
- Conserve energy – switch off the lights and fans when not in use. This will help to save electricity which requires a lot of burning fossil fuels.
The Delhi government is planning to install air purifiers, mist fountains as a pilot project to curb air pollution. Ban on sale and usage of pet-coke and furnace oil in 4 states of region. From 1 July 2018, only zigzag-technology compliant brick kilns will be allowed to operate in NCR Delhi. Decision to permanently close Badarpur power plant in July 2018 is a step in right direction.
Government strategies are the initial step but still long miles to go, again comes the point of implementation. Yes, the strategies should be extended to the smaller cities also. Some of the examples where stringent measures should be taken are like the government should take steps to stop thermal power plants and should implement solar power, so that coal burning and coal mining could be stopped resulting which, carbon monoxide emission and particulate matter can be arrested.
In this regard, India shall take a leaf from China which has taken a conscious decision to bear a significant economic cost to reduce air pollution which included shuttering steel mills, thermal power plants, relocating polluting industries out of cities, creating infrastructure for cycle bikes, keeping vehicles out of certain designated zones in the cities, etc.
Author – Santosh
References
- World Health Organization (2018). 9 out of 10 people worldwide breath polluted air but more countries are taking action. Press Release. WHO, Geneva, 2 May 2018
- TNN (2017). Top 8 main causes for air pollution in Delhi. E Times, Times of India, New Delhi. 15 November 2017
Recent Comments