
As more and more sectors and areas re-open after the lockdown and more industrial activities start, the air pollution in the country starts increasing. The quarter of July-September 2020 show an increasing trend in Air pollution which clearly indicate that most of the pollution was caused due to Industrial activity, Construction and Vehicles which was curtailed during the lockdown due to Corona Pandemic. A brief analysis of data captured through low cost air monitors installed at different locations is presented in this report for the quarter July – September 2020
Chart 1 and Table 1 shows the data for the Monthly Average AQI values in different cities for the period July 2019 to September 2020.
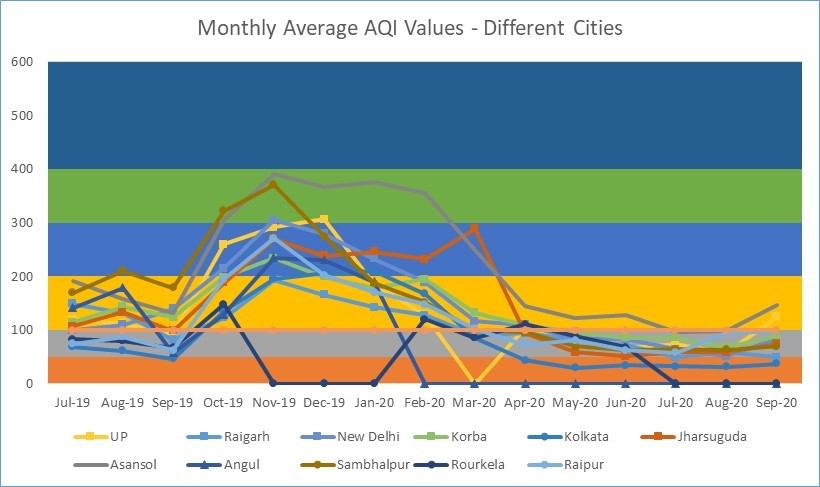
Chart 1- Monthly Average AQI values – Different Cities July 2019 – September 2020
| Jul-19 | Aug-19 | Sep-19 | Oct-19 | Nov-19 | Dec-19 | Jan-20 | Feb-20 | Mar-20 | Apr-20 | May-20 | Jun-20 | Jul-20 | Aug-20 | Sep-20 | |
| Tatiyaganj (UP) | 120 | 112 | 93 | 260 | 291 | 306 | 187 | 129 | – | 105 | 88 | 66 | 74 | 57 | 125 |
| Raigarh | 149 | 132 | 82 | 123 | 194 | 166 | 142 | 127 | 90 | 94 | 82 | 73 | 50 | 60 | 49 |
| New Delhi | 100 | 110 | 140 | 215 | 305 | 280 | 233 | 190 | 116 | 110 | 84 | 84 | 64 | 52 | 83 |
| Korba | 115 | 144 | 124 | 199 | 234 | 200 | 179 | 195 | 132 | 109 | 97 | 86 | 86 | 68 | 89 |
| Kolkata | 69 | 61 | 47 | 136 | 196 | 206 | 211 | 168 | 86 | 44 | 30 | 35 | 33 | 32 | 38 |
| Jharsuguda | 107 | 133 | 99 | 189 | 270 | 238 | 246 | 232 | 289 | 95 | 59 | 52 | 58 | 58 | 75 |
| Asansol | 191 | 158 | 133 | 305 | 391 | 368 | 376 | 356 | 250 | 144 | 122 | 128 | 97 | 99 | 146 |
| Angul | 141 | 179 | 58 | 129 | 235 | 231 | 190 | – | – | – | – | – | – | – | – |
| Sambhalpur | 169 | 211 | 179 | 322 | 371 | 275 | 187 | 152 | 101 | 96 | 70 | 62 | 64 | 64 | 70 |
| Rourkela | 84 | 81 | 67 | 149 | – | – | – | 120 | 85 | 111 | 89 | 68 | – | – | – |
| Champawat | 84 | 140 | – | – | – | – | – | – | – | – | – | – | – | – | – |
| Raipur | 75 | 87 | 63 | 195 | 272 | 203 | 170 | 149 | 103 | 72 | 81 | 63 | 58 | 96 | 98 |
Table 1 – Monthly Average AQI values – Different Cities May 2019 – June 2020
- All places except Raigarh are witnessing an increase in AQI in September 2020.
- The AQI in the quarter in 2020 is better than the corresponding period in 2019
- Worst AQI recorded in the period was at Asansol with a value of 391 whereas Kolkata had the distinction of recording the best AQI value of 32 (Good) in the month of August 2020.
- Raipur recorded 5 consecutive months when the AQI was in the satisfactory category
- The entire quarter, Kolkata AQI has been the best and has been in Good category
- AQI in New Delhi and Korba was recorded in Satisfactory range since May 2020. Looking at trends, the AQI will move into the polluted range in October. Although individual days were bad in both New Delhi and Korba, the monthly AQI was brought into the satisfactory range. This reflects clearly that as more industrial activities and vehicular movements began post lockdown, the AQI has been impacted accordingly.
For the quarter of July-20 to September-20, again Asansol maintained its position of worst AQI and all through the quarter. Even looking at monthly AQI figures, Asansol was consistently the worst performer. Kolkata has been the best location for AQI with air being recorded in the ‘Good’ category for the entire quarter
All cities have recorded a continuous improvement in AQI in the quarter.
| Jul-18 | Jul-19 | Jul-20 | Aug-18 | Aug-19 | Aug-20 | Sep-18 | Sep-19 | Sep-20 | |||
| Tatiyaganj (UP) | 95 | 120 | 74 | 109 | 112 | 57 | 137 | 93 | 125 | ||
| Raigarh | 64 | 149 | 50 | 112 | 132 | 60 | – | 82 | 49 | ||
| New Delhi | 95 | 100 | 64 | 76 | 110 | 52 | 83 | 140 | 83 | ||
| Korba | 155 | 115 | 86 | 158 | 144 | 68 | 197 | 124 | 89 | ||
| Kolkata | 59 | 69 | 33 | 59 | 61 | 32 | 59 | 47 | 38 | ||
| Jharsuguda | 76 | 107 | 58 | – | 133 | 58 | – | 99 | 75 | ||
| Asansol | 126 | 191 | 97 | 154 | 158 | 99 | 199 | 133 | 146 | ||
| Angul | 181 | 141 | – | 243 | 179 | – | 436 | 58 | – | ||
| Sambhalpur | 83 | 169 | 64 | 109 | 211 | 64 | 115 | 179 | 70 | ||
| Rourkela | – | 84 | – | – | 81 | – | – | 67 | – | ||
| Champawat | – | 84 | – | – | 140 | – | – | – | – | ||
| Raipur | – | 75 | 58 | – | 87 | 96 | – | 63 | 98 |
Table 2 – Monthly AQI for 2018 V/s 2019 V/s 2020
A comparison of AQI in the city as in Table 2 with the corresponding period of 2018 and 2019 show improvement in all places.
| 0-50 (Good) | 51-100 (Satisfactory) | 101-200 (Moderately polluted) | 201-300 (Poor) | 301-400 (Very Poor) | >401 (Severe) |
AQI categories as per NAAQ Standards
| 0-50 | 51-100 | 101-200 | 201-300 | 301-400 | >401 | Not Work | |||
| New Delhi | July | 7 | 24 | 0 | 0 | 0 | 0 | 0 | 31 |
| Aug | 15 | 16 | 0 | 0 | 0 | 0 | 0 | 31 | |
| Sep | 3 | 22 | 5 | 0 | 0 | 0 | 0 | 30 | |
| Korba | July | 0 | 26 | 5 | 0 | 0 | 0 | 0 | 31 |
| Aug | 4 | 25 | 2 | 0 | 0 | 0 | 0 | 31 | |
| Sep | 1 | 19 | 10 | 0 | 0 | 0 | 0 | 30 | |
| Kolkata | July | 27 | 4 | 0 | 0 | 0 | 0 | 0 | 31 |
| Aug | 21 | 4 | 0 | 0 | 0 | 0 | 6 | 31 | |
| Sep | 2 | 0 | 0 | 0 | 0 | 0 | 28 | 30 | |
| Jharsuguda | July | 9 | 22 | 0 | 0 | 0 | 0 | 0 | 31 |
| Aug | 9 | 17 | 0 | 0 | 0 | 0 | 5 | 31 | |
| Sep | 9 | 13 | 8 | 0 | 0 | 0 | 0 | 30 | |
| Asansol | July | 0 | 12 | 9 | 0 | 0 | 0 | 10 | 31 |
| Aug | 1 | 12 | 10 | 0 | 0 | 0 | 8 | 31 | |
| Sep | 0 | 10 | 13 | 2 | 0 | 3 | 2 | 30 | |
| Raipur | July | 2 | 2 | 1 | 0 | 0 | 0 | 26 | 31 |
| Aug | 2 | 9 | 0 | 1 | 0 | 0 | 19 | 31 | |
| Sep | 1 | 16 | 9 | 1 | 0 | 0 | 3 | 30 | |
| Raigarh | July | 16 | 14 | 0 | 0 | 0 | 0 | 1 | 31 |
| Aug | 5 | 7 | 0 | 0 | 0 | 0 | 19 | 31 | |
| Sep | 3 | 2 | 0 | 0 | 0 | 0 | 25 | 30 | |
| Sambhalpur | July | 3 | 28 | 0 | 0 | 0 | 0 | 0 | 31 |
| Aug | 7 | 21 | 1 | 1 | 0 | 1 | 0 | 31 | |
| Sep | 8 | 17 | 5 | 0 | 0 | 0 | 0 | 30 |
Table 3– Number of Days – AQI Categories
Table 3 shows the number of days AQI was recorded under different AQI categories in different cities for the quarter. As can be seen, AQI in most of the cities was majorly in the Satisfactory category. In Kolkata, It was in the Good category. At Asansol and Korba, more than 10 days in September have been recorded in the Polluted category.
During July 2020
- 1201180019 placed at Korba had the worst AQI at 146
- 3 devices (1201180030, 1212170165, 1201180119) all placed at Korba recorded AQI more than or equal to 100
- 1211170021 placed at Kolkata recorded the best AQI of 33
- Monsoon season all over the country had a very visible impact for low AQI values
For August 2020
- 1211170021 placed at Kolkata recorded the best AQI of 32
- 6 devices placed at different locations in Delhi & Korba recoded monthly AQI less than 50
- 1201180019 placed at Korba had the worst AQI at 103
- All other devices had AQI between 50 and 100
For September 2020
- 1211170021 placed at Kolkata recorded the best AQI of 38
- 1201180092 (Korba) and 1201180059 (Raigarh) recorded AQI below 50
- 1201180019 placed at Korba again had the worst AQI at 155
- 1212170020 (Tatiyaganj), 1201180030 (Korba), 1201180091 (Asansol), 1212170167 (Delhi) and 1201180119 (Korba) had AQi more than 100 but less than 150
Below are some graphs for AQI at different locations for the quarter
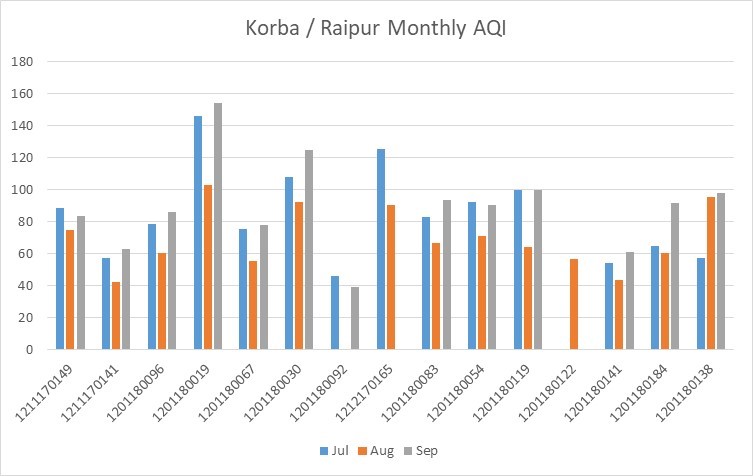
Chart 2 – AQI for different devices at Korba/Raipur
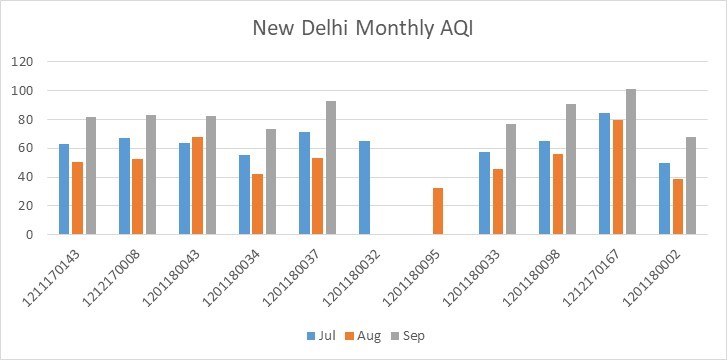
Chart 3- AQI for different devices at New Delhi
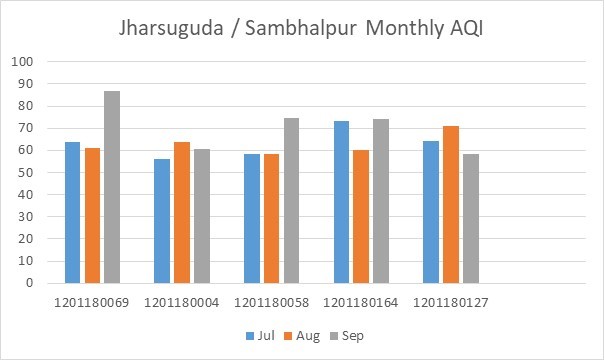
Chart 4 – AQI for different devices at Rourkela / Sambhalpur / Jharsuguda
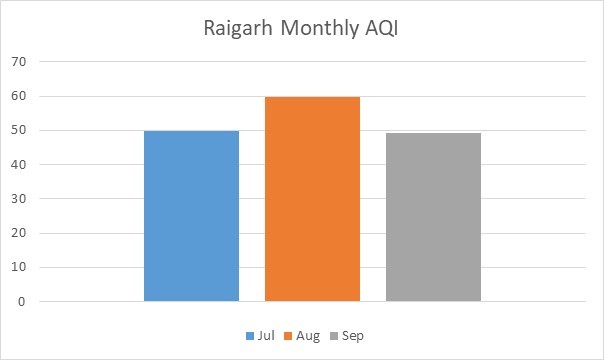
Chart 5 – AQI for different devices at Raigarh
The data clearly shows the gains in AQI due to restricted pollution causing activities. The data also shows that these gains can be very easily and quickly lost if these pollution causing activities continue as before without adequate control measures. Administrative steps are important to be taken, rules should be implemented strictly and anybody floundering the rules for controlling air pollution should be severely penalised. With Covid Virus still causing havoc all over the world and particularly weakening the lungs of the effected people, high pollution levels will leave everyone exposed at higher risk and urgent steps are needed to curtail pollution.
Author – Mohit Gupta
Note – The devices used are low cost air pollution monitoring devices which ae capable of measuring PM 2.5 and PM 10 using laser measuring method. The data from these devices is transmitted using GPRS and is collected in a central location. The devices have been placed in different cities in consultation with the communities residing in those areas.
Recent Comments