
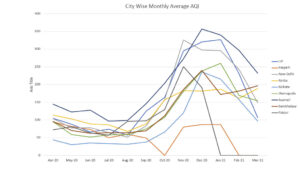
- For the sake of comparison two periods are compared above i.e. April 2019 to March 2020 and April 2020 to March 2021.
- The first two quarters from Apr 20 to Sep 20 show a much better air quality scenario when the nation wide lockdown was in works. During the same period, in the previous year showed AQI surpassing 100 in most of the cities.
- While the AQI started deteriorating from September 2019 onwards in the 2019-20 period, it was only in November 2020 that the AQI started deteriorating due to onset of winters as well as restarting of the economic activities.
- The first quarter of 2021 show similar trends in both the years with AQI transitioning to better category in March.
- Jharsuguda and Asansol improved in the first quarter and the transition can be seen in the tables below. Alternatively, Delhi and UP showed better AQI for the first quarter of 2019.
Table 1 – More greener phase during full and partial lockdown in 2020
| Cities | Apr-20 | May-20 | Jun-20 | Jul-20 | Aug-20 | Sep-20 | Oct-20 | Nov-20 | Dec-20 | Jan-21 | Feb-21 | Mar-21 |
| UP | 105 | 88 | 66 | 74 | 57 | 125 | 164 | 295 | 320 | 327 | 230 | 107 |
| Raigarh | 94 | 82 | 73 | 50 | 60 | 49 | 0 | 80 | 87 | 87 | 0 | 0 |
| New Delhi | 104 | 77 | 79 | 64 | 52 | 83 | 158 | 326 | 298 | 296 | 243 | 149 |
| Korba | 114 | 103 | 89 | 86 | 68 | 89 | 157 | 183 | 182 | 187 | 162 | 189 |
| Kolkata | 44 | 30 | 35 | 33 | 32 | 38 | 66 | 120 | 236 | 215 | 157 | 97 |
| Jharsuguda | 95 | 59 | 52 | 58 | 58 | 75 | 107 | 181 | 238 | 260 | 169 | 155 |
| Asansol | 144 | 122 | 128 | 97 | 99 | 146 | 204 | 273 | 357 | 340 | 296 | 232 |
| Sambhalpur | 96 | 70 | 62 | 64 | 64 | 70 | 111 | 186 | 240 | 172 | 181 | 197 |
| Raipur | 72 | 81 | 63 | 58 | 96 | 98 | 130 | 251 | 192 | 0 | 0 | 0 |
| Cities | Apr-19 | May-19 | Jun-19 | Jul-19 | Aug-19 | Sep-19 | Oct-19 | Nov-19 | Dec-19 | Jan-20 | Feb-20 | Mar-20 |
| UP | 152 | 272 | 334 | 120 | 112 | 93 | 260 | 291 | 306 | 187 | 129 | 0 |
| Raigarh | 0 | 0 | 121 | 149 | 132 | 82 | 123 | 194 | 166 | 142 | 127 | 90 |
| New Delhi | 110 | 100 | 99 | 100 | 110 | 140 | 215 | 305 | 280 | 251 | 185 | 108 |
| Korba | 157 | 132 | 139 | 115 | 144 | 124 | 199 | 234 | 200 | 179 | 197 | 138 |
| Kolkata | 63 | 102 | 109 | 69 | 61 | 47 | 136 | 196 | 206 | 211 | 168 | 86 |
| Jharsuguda | 0 | 0 | 207 | 107 | 133 | 99 | 189 | 270 | 238 | 246 | 232 | 289 |
| Asansol | 188 | 210 | 210 | 191 | 158 | 133 | 305 | 391 | 368 | 376 | 356 | 250 |
| Sambhalpur | 125 | 109 | 202 | 169 | 211 | 179 | 322 | 371 | 275 | 187 | 152 | 101 |
| Raipur | 80 | 80 | 82 | 75 | 87 | 63 | 195 | 272 | 203 | 170 | 149 | 103 |
- Kolkata pulled back to Good AQI category for six months straight from April 2020 – the trend not witnessed in 2019.
- From the data it can be interpreted that Asansol remained in the very poor category in 2019 for five straight months from October2019 to February 2019 whereas only two poor category months are seen for 2020-2021.
| Jan-19 | Jan-20 | Jan-21 | Feb-19 | Feb-20 | Feb-21 | Mar-19 | Mar-20 | Mar-21 | |
| UP | 311 | 187 | 327 | 311 | 129 | 230 | 198 | – | 107 |
| Raigarh | – | 142 | 87 | – | 127 | – | – | 90 | – |
| New Delhi | 208 | 251 | 296 | 208 | 185 | 243 | 130 | 108 | 149 |
| Korba | 195 | 179 | 187 | 195 | 197 | 162 | 155 | 138 | 189 |
| Kolkata | 156 | 211 | 215 | 156 | 168 | 157 | 102 | 86 | 97 |
| Jharsuguda | – | 246 | 260 | – | 232 | 169 | – | 289 | 155 |
| Asansol | 259 | 376 | 340 | 263 | 356 | 296 | 268 | 250 | 232 |
| Angul | 117 | 190 | – | 132 | – | – | 110 | – | – |
| Sambhalpur | 146 | 187 | 172 | 146 | 152 | 181 | 131 | 101 | 197 |
| Rourkela | 124 | 82 | – | 124 | 120 | – | 124 | 85 | – |
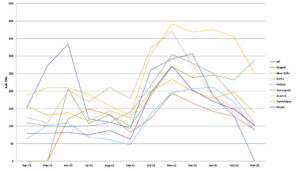
- Looking at the table above, it is clear that transition in AQI categories is taking place in the same period over different years.
- Even if there is no AQI category transition (i.e. from good to poor or from poor to good) there are intra variations in the AQI range which indicates milder or increased activities. This goes on to indicate that air quality is dynamic and a pollution source which may be a point source or a line source will impact areas even far away from the source as the pollutants mix with ambient air and disperse as per the prevailing weather conditions.
| 0-50 | 51-100 | 101-200 | 201-300 | 301-400 | >401 | Not Work | |||
| New Delhi | Jan | 0 | 0 | 2 | 18 | 8 | 3 | 0 | 31 |
| Feb | 0 | 0 | 10 | 12 | 5 | 1 | 0 | 28 | |
| Mar | 0 | 1 | 27 | 3 | 0 | 0 | 0 | 31 | |
| Korba | Jan | 0 | 2 | 17 | 11 | 1 | 0 | 0 | 31 |
| Feb | 0 | 1 | 24 | 0 | 0 | 0 | 3 | 28 | |
| Mar | 0 | 0 | 23 | 7 | 0 | 0 | 1 | 31 | |
| Kolkata | Jan | 0 | 0 | 12 | 19 | 0 | 0 | 0 | 31 |
| Feb | 0 | 3 | 18 | 7 | 0 | 0 | 0 | 28 | |
| Mar | 0 | 15 | 15 | 0 | 0 | 0 | 1 | 31 | |
| Jharsuguda | Jan | 0 | 0 | 4 | 8 | 4 | 0 | 15 | 31 |
| Feb | 0 | 1 | 17 | 10 | 0 | 0 | 0 | 28 | |
| Mar | 0 | 4 | 23 | 2 | 2 | 0 | 0 | 31 | |
| Asansol | Jan | 0 | 0 | 0 | 6 | 22 | 3 | 0 | 31 |
| Feb | 0 | 0 | 1 | 9 | 18 | 0 | 0 | 28 | |
| Mar | 0 | 0 | 6 | 17 | 2 | 0 | 6 | 31 | |
| Raigarh | Jan | 0 | 20 | 7 | 0 | 0 | 0 | 4 | 31 |
| Feb | 6 | 8 | 2 | 0 | 0 | 0 | 12 | 28 | |
| Mar | 4 | 1 | 0 | 0 | 0 | 0 | 26 | 31 | |
| Sambhalpur | Jan | 0 | 0 | 5 | 9 | 3 | 0 | 14 | 31 |
| Feb | 0 | 14 | 11 | 1 | 0 | 0 | 2 | 28 | |
| Mar | 4 | 0 | 0 | 0 | 0 | 0 | 0 | 4 | |
| 70 | 224 | 139 | 65 | 7 |
- Very few locations in the Good to Satisfactory category except Kolkata in March, Sambalpur and Raigarh too showed satisfactory AQI.
- Only in March Delhi improved to Moderately polluted category. Asansol is the only location where AQI for most of the months of January and February remained in very poor category.
- Delhi and Asansol each had 3 days of severe AQI in the month of January. Maximum concentration of AQI across all locations was in the poor category.
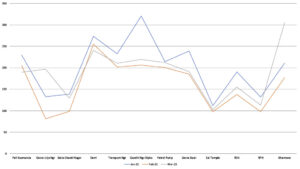
- AQI remained above 200 at Transport Nagar, Gandhi Nagar and Petrol Pump.
- No where the AOI is even in the satisfactory category except Urja Nagar, Shanti Naga, Sai Temple and RP Nagar for the month of February.
- AQI rose to moderately polluted to poor across January through March 2021.
- Worst AQI of 321 was noticed in Dipka mines for the month of January with the minimal reaching 206 in the month of February.
Recent Comments