
DMF was instituted in March 2015, under the Mines and Minerals (Development and Regulation) Amendment Act 2015. It has been conceptualised as a benefit-sharing mechanism with mining-affected communities, recognising them as partners in natural resource-led development. Based on the information available, some key note are as below [1]
- Out of the total projects sanctioned, 69% remain in the high priority areas and the remaining in the other priority areas.
- Funds in excess of 74% of the total sanctioned amount is allocated to these three sectors
- Drinking Water Supply, Education and Health remain the three top sectors both in terms of number of projects as well as in terms of amounts sanctioned and Amount spent
- Merely 2.25% of amount sanctioned for environment preservation and pollution control
- The ‘others’ category is the 4th largest in terms of percentage of amount spent but there is no detailing what constitutes this category
- In the other priority sector, physical infrastructure takes the lead with 79% of the projects, 73% allocation and 67% of the total amount spent.
- Only 6.03% of the total allocated amount for other priority projects is for enhancing environmental quality in mining district.
- Out of the total allocated amount of Rs. 48,162 Crore, Rs. 1762 crore has been allocated for improvement of environment.
| Sector | No. of Projects | Amount Sanctioned (Cr.) | Amount Spent (Cr.) | |
| 1 | Drinking water supply | 46267 | 11150.40 | 6435.16 |
| 2 | Health | 16628 | 4992.91 | 3207.99 |
| 3 | Education | 42296 | 7102.87 | 3089.53 |
| 4 | Other | 10039 | 3012.99 | 2028.35 |
| 5 | Sanitation | 10947 | 1572.45 | 869.49 |
| 6 | Welfare of Women and Children. | 13021 | 1579.72 | 598.31 |
| 7 | Skill development | 5146 | 968.89 | 522.03 |
| 8 | Environment Preservation and pollution control measures. | 5419 | 704.53 | 354.23 |
| 9 | Welfare of aged and disabled people. | 876 | 133.03 | 74.53 |
| Sub Total – High Priority Sector | 150639 | 31217.79 | 17179.62 | |
| 1 | Physical infrastructure | 53466 | 12406.91 | 5657.37 |
| 2 | Irrigation. | 3740 | 1778.51 | 1112.33 |
| 3 | Any other measures for enhancing environmental quality in mining district. | 1317 | 1021.56 | 864.83 |
| 4 | Energy and watershed development. | 8019 | 738.85 | 476.27 |
| 5 | Other | 1153 | 997.91 | 298.68 |
| Sub Total – Other Priority Sector | 67695 | 16943.74 | 8409.48 | |
| Grand Total | 218334 | 48162 | 25589 |
COMPARISON OF TWO LARGE MINING STATES IN TERMS OF DMF ALLOCATIONS –
Orissa and Chhattisgarh have almost similar amount allocated under various heads from the DMF fund. The comparable allocated amounts thus allow for cross comparison among different sectors for which various amounts have been allocated.
Each state has its own priorities and thus this comparison is to see proportionate difference among various sectors which reflect their priorities but whether these priorities fit the objective of ‘welfare of the affected’ can only be seen when the complete information is available along with community feedback on the same.
Looking at certain high allocations in some of the sectors is given below (as per information available from respective state portals on DMF) –
| Table 2 – Key High Allocation Sectors Compared | ||||
| SECTORS | Chhattisgarh | % | Odisha | % |
| Drinking Water Supply | 443.14 | 7.23 | 1531.55 | 23.85 |
| Health | 614.69 | 10.03 | 652.58 | 10.16 |
| Education | 1366.33 | 22.30 | 529.61 | 8.25 |
| Physical Infrastructure | 1740.68 | 28.41 | 1961.85 | 30.55 |
| Irrigation | 209.86 | 3.43 | 669.4 | 10.43 |
| Livelihood Development | 93.36 | 1.52 | 623.48 | 9.71 |
| Total of above Sectors | 4468.06 | 72.92 | 5968.47 | 92.95 |
| Total of All Sectors# | 6126.95 | 6420.94 | ||
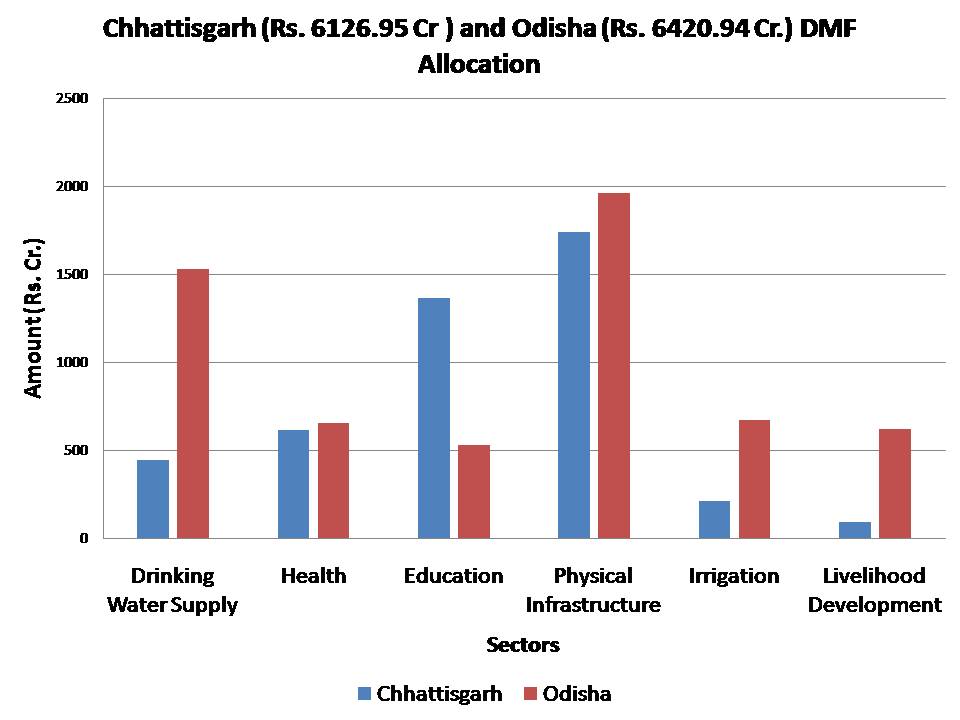
- In terms of physical infrastructure which comes under ‘other priority areas’, takes the maximum share of allocation as it is high capital-intensive sector. Odisha allocated 30.55% whereas Chhattisgarh allocated 28.41% funds allocated to this sector. As several settlements are surrounding or even abutting the mining areas, the same road is used by communities as well as for mineral transport. But the fact that this comes with a risk of accidents, air pollution and nuisance, any decision for such roads have thus to be taken under guidance of experts.
- Odisha leads with 23.85% funds towards drinking water supply projects whereas Chhattisgarh has 7.23% funds allocated to its share of total allocation. Mining has a direct impact on water resources varying from leading to quantum variations, wastewater contribution, lowering of ground water resources and pollution of surface water resources.
- Chhattisgarh leads with 22.30% of its funds allocated to education sector whereas Odisha has an allocation of 8.25%. But the quality of investment is not known as many of the projects might be just building boundary walls or alike. Whether anything is invested in quality education or smart allocations owing to Covid pandemic is unknown.
- Irrigation is another sector where Odisha leads with allocations to the tune of 10.43% and Chhattisgarh has 3.43% allocation for irrigation. It must be kept in mind that many of the industrial projects also seek permissions and allocations for their use and whether these irrigations schemes, especially small schemes may get impacted the most in case allocation share is disturbed by the industrial sector
- Odisha has 8% points more allocation (9.71%) for livelihood development than Chhattisgarh (1.52%). Here too, sustainable livelihoods need to be driven by resource availability and life cycle assessment so that the resource base is not impacted by the mining activity which is growing.
- Chhattisgarh has a lead in terms of creating training and capacity building of Gram Sabhas for planning and monitoring of various developmental schemes executed under the Trust funds. An amount of 6.43 Crore is allocated for the purpose. 78 such projects have been allocated this amount.
- For Environment conservation both the states have low allocations – for Chhattisgarh 2.77% and Odisha 1.49%
To sum up, the utmost need is to make the information more transparent so that the funds are invested in the right spirit and towards communities’ priorities. The high priority sector may be a terminology by the Government suited for mining area development but it may not be the same for the communities at micro level. Thus, the information should be rolled out at the lowest level of implementation i.e. Gram Sabha and collated at specific clusters.
The ‘others’ category should be elaborated so that it is clear where the funds are being spent.
Like the nation wide MGNREGA programme which has a portal providing village wise information is a good example for carrying out a similar exercise for the District Mineral Foundation. Although MGNREGA is a central programme but the information is provided by the state governments and the same can be attempted for the DMF too. Platforms like Bhuvan can be useful in providing spatial information. In case of MGNREGA, availability of information and its auditing has enabled plugging of loopholes and has made the programme much better from its existence.
Recent Comments