With the onset of winter, Air pollution becomes a major problem especially in the Northern part of the country. Delhi and surrounding areas bear the brunt of this problem due to various reasons which include vehicular and industrial exhaust, bio-mass burning, construction and road dust etc. But not just Delhi, Air pollution also becomes a critical issue in mining and industrial areas.

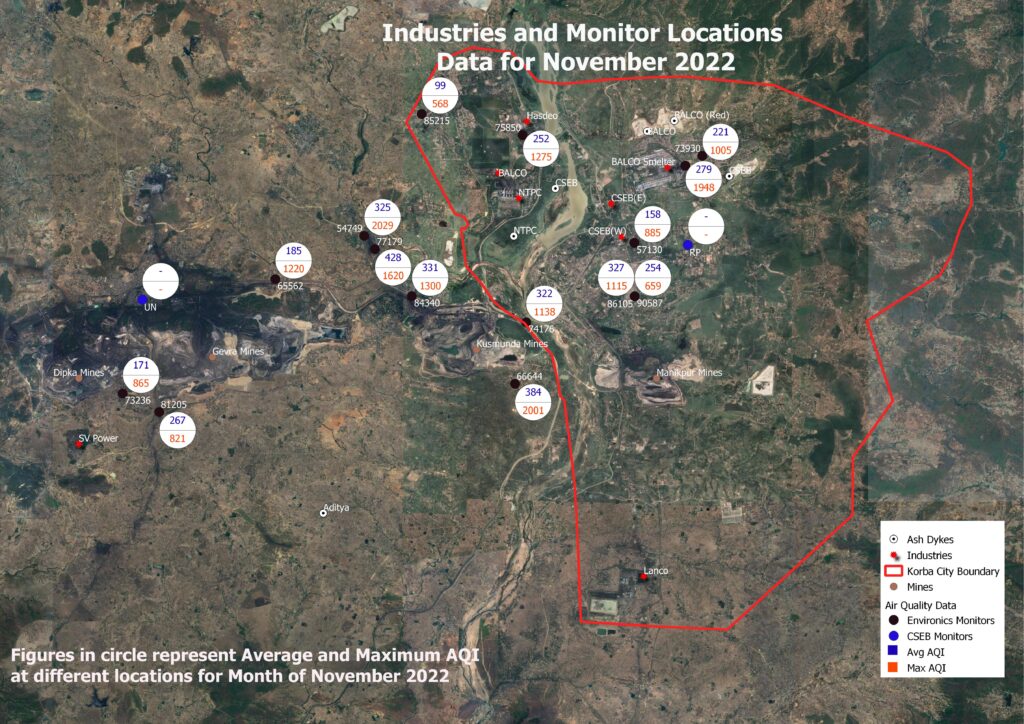
Below is a brief representation of data captured by portable devices installed in multiple locations in Korba, Delhi and Ranchi. The analysis has been done for two reporting periods – 1 November to 30 November 2022 and Jan to November 2022

Section 1 – Data Analysis for period Jan to November 2022

Monthly Average AQI – Different Cities
Jan Feb Mar Apr May Jun Jul Aug Sep Oct Nov
Korba 344 239 304 256 102 118 72 80 93 204 320
Delhi 355 303 218 133 98 75 71 67 85 323 380
Ranchi 200 81 77 159 158


Table and Graph above show the Average Monthly AQI in different Cities. The graph and data clearly showcase the winter months when AQI comes under dangerous levels and summer and monsoon months when the air quality is Satisfactory. It is clear that AQI is showing an increasing trend with the onset of winter. Air quality improvement needs to be yearlong activity and the base load factors like vehicle exhausts, industrial exhausts, construction dust etc need to be controlled better. Currently in the entire country the base load of air pollutants is very high and any short or seasonal factors take the air quality into severe one which can be very hazardous for health. During this period, Delhi recorded the worst AQI in the month of November. Out of 11 months, for 6-month AQI in Delhi was above 100 while Korba had AQI above 100 for 9 months. The overall data for Korba shows that Korba Air is more polluted than Delhi for longer durations in the year.  The different colour bands in the graph respond to the AQI categories as stated in the NAAQs

Korba [1] : 248Korba [2] : 256Korba [3] : 276Korba [4] : 327Korba [5] : 317Korba [6] : 322Korba [7] : 263Korba [8] : 272Korba [9] : 256Korba [10] : 242Korba [11] : 284Korba [12] : 276Korba [13] : 282Korba [14] : 263Korba [15] : 301Korba [16] : 266Korba [17] : 249Korba [18] : 233Korba [19] : 267Korba [20] : 266Korba [21] : 273Korba [22] : 293Korba [23] : 265Korba [24] : 228Korba [25] : 235Korba [26] : 259Korba [27] : 284Korba [28] : 300Korba [29] : 306Korba [30] : 296248256276327317322263272256242284276282263301266249233267266273293265228235259284300306296New Delhi [1] : 466New Delhi [2] : 431New Delhi [3] : 593New Delhi [4] : 518New Delhi [5] : 418New Delhi [6] : 370New Delhi [7] : 341New Delhi [8] : 409New Delhi [9] : 290New Delhi [10] : 317New Delhi [11] : 366New Delhi [12] : 364New Delhi [13] : 377New Delhi [14] : 318New Delhi [15] : 285New Delhi [16] : 236New Delhi [17] : 305New Delhi [18] : 307New Delhi [19] : 283New Delhi [20] : 344New Delhi [21] : 320New Delhi [22] : 247New Delhi [23] : 216New Delhi [24] : 226New Delhi [25] : 331New Delhi [26] : 376New Delhi [27] : 354New Delhi [28] : 428New Delhi [29] : 450New Delhi [30] : 390466431593518418370341409290317366364377318285236305307283344320247216226331376354428450390Ranchi [1] : 102Ranchi [2] : 253Ranchi [3] : 217Ranchi [4] : 110Ranchi [5] : 188Ranchi [6] : 234Ranchi [7] : 200Ranchi [8] : 180Ranchi [9] : 183Ranchi [10] : 151Ranchi [11] : 138Ranchi [12] : 137Ranchi [13] : 194Ranchi [14] : 229Ranchi [15] : 180Ranchi [16] : 157Ranchi [17] : 119Ranchi [18] : 121Ranchi [19] : 127Ranchi [20] : 110Ranchi [21] : 117Ranchi [22] : 131Ranchi [23] : 76Ranchi [24] : 107Ranchi [25] : 109Ranchi [26] : 122Ranchi [27] : 132Ranchi [28] : 192Ranchi [29] : 209Ranchi [30] : 18210225321711018823420018018315113813719422918015711912112711011713176107109122132192209182Daily Average AQI - Different CitiesNovember 2022123456789101112131415161718192021222324252627282930Date0100200300400500600AQIKorbaNew DelhiRanchi

Read Report