
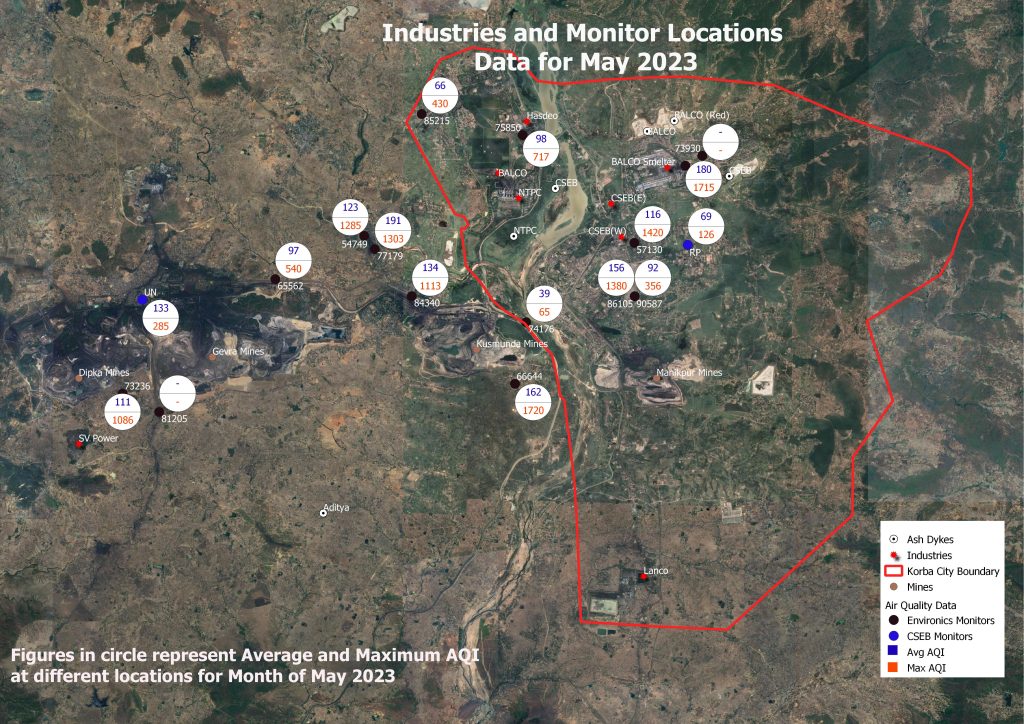
Below is a brief representation of data captured by portable devices installed in multiple locations in Korba and Delhi. The analysis has been done for two reporting periods – 1 May to 31 May 2023 and Jan 2022 to May 2023.
Section 1 – Data Analysis for period Jan 2022 to May 2023
| Monthly Average AQI – Different Cities | |||||||||||||||||
| Jan | Feb | Mar | Apr | May | Jun | Jul | Aug | Sep | Oct | Nov | Dec | Jan-23 | Feb-23 | Mar-23 | Apr-23 | May-23 | |
| Korba | 344 | 239 | 304 | 256 | 102 | 118 | 72 | 80 | 93 | 204 | 320 | 318 | 319 | 283 | 245 | 197 | 124 |
| Delhi | 355 | 303 | 218 | 133 | 98 | 75 | 71 | 67 | 85 | 323 | 380 | 372 | 412 | 328 | 198 | 125 | 124 |
| Ranchi | 200 | 81 | 77 | 159 | 158 | 198 | |||||||||||
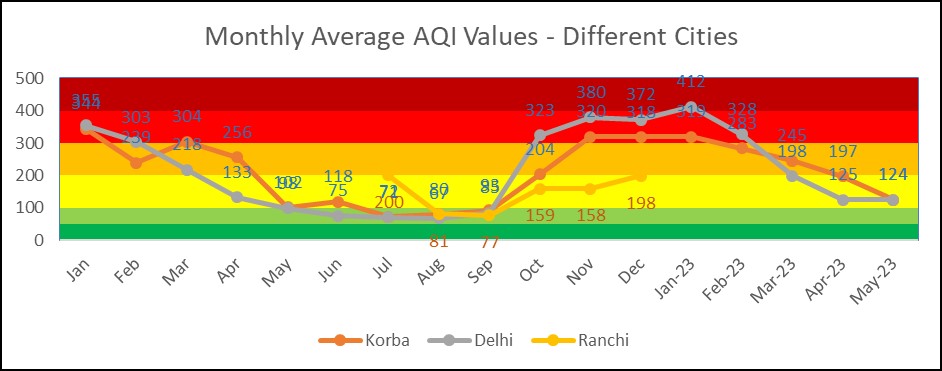
Table and Graph above show the Average Monthly AQI in different Cities. The graph and data clearly showcase the winter months when AQI comes under dangerous levels and summer and monsoon months when the air quality is Satisfactory. It is clear that AQI increased with the onset of winter and has started decreasing as summer progresses.
- During this period, Delhi recorded the worst AQI in the month of January 2023. Out of 17 months, for 13-months AQI in Delhi was above 100 while Korba had AQI above 100 for 15 months.
- May 2023 Air quality has improved over the previous month figures for both Delhi and Korba. Delhi witnessed incessant rains and high winds during most of the month of May 2023 which resulted in better air quality. May 2023 was one of the wettest months in almost 30 years which resulted in good air quality.
- The overall data for Korba shows that Korba Air is more polluted than Delhi for longer durations in the year.
- However, despite favourable weather conditions, May 2023 AQI has deteriorated in both Korba and Delhi.
- The different colour bands in the graph respond to the AQI categories as stated in the NAAQs
| Monthly Average HI – Different Cities | |||||||||||||||||
| Jan | Feb | Mar | Apr | May | Jun | Jul | Aug | Sep | Oct | Nov | Dec | Jan-23 | Feb-23 | Mar-23 | Apr-23 | May-23 | |
| Korba | 19 | 24 | 29 | 36 | 40 | 39 | 37 | 35 | 35 | 30 | 23 | 21 | 21 | 24 | 29 | 32 | 35 |
| Delhi | 17 | 20 | 26 | 32 | 35 | 36 | 39 | 37 | 36 | 28 | 24 | 18 | 16 | 21 | 25 | 29 | 32 |
| Ranchi | 31 | 30 | 29 | 24 | 20 | 18 | – | – | – | ||||||||
The above table shows the Monthly Average Heat Index for different cities.
Particulate Matter – Paniculate matter or PM is the amount of dust particles in the air. These particles can be of different types i.e. organic, metallic etc. There are different sizes for these particles. Particles of size 10 micron are called PM 10. Those between size of 2.5 and 10 micron are called PM 2.5. those between 1 and 2.5 micron are labelled as PM1. The smaller the size of the particles, the easier for it to enter the air stream of the body and cause more impact. NAAQS and WHO (Word Health Organisation) have both set limits for amount of such particles in the air for PM 2.5 and PM 10. Below are the limits set. The Indian standard values are much higher than the WHO ADQ standard and need to be revised downwards. There are no standards yet for PM 1 which is considerably more harmful.
| PM 2.5 (ug/m3) | PM 10 (ug/m3) | |
| NAAQS (Annual target) | 40 | 60 |
| WHO Interim target 1 | 35 | 70 |
| WHO ADQ Target | 5 | 15 |
Below is the table showing Monthly Average PM 2.5 values in different cities. In none of the months did any of the cities meet the higher Indian standard with Delhi touching the standard only in August 2022. In both Delhi and Korba, the values were more than 4 times the values in some of the months. Only during the monsoon period were the values closer to the standard but were still above. In Delhi and Korba both, the PM 2.5 particles have decreased in comparison to April 2023
|
Monthly Average PM 2.5 – Different Cities |
|||||||||||||||||
| Jan | Feb | Mar | Apr | May | Jun | Jul | Aug | Sep | Oct | Nov | Dec | Jan-23 | Feb-23 | Mar-23 | Apr-23 | May-23 | |
| Korba | 177 | 102 | 125 | 107 | 61 | 65 | 43 | 48 | 56 | 91 | 146 | 144 | 145 | 115 | 104 | 89 | 67 |
| Delhi | 191 | 124 | 95 | 70 | 59 | 45 | 43 | 40 | 51 | 150 | 224 | 214 | 266 | 156 | 89 | 68 | 67 |
| Ranchi | 90 | 48 | 46 | 78 | 77 | 89 | |||||||||||
Recent Comments