

With the end of monsoon season, Air pollution has started deteriorating in the country esp. in the northern part of the country. Air pollution is a big issue and needs to be handled urgently. Air sheds which stretch across geographical boundaries need to be understood and plans made. Every stakeholder needs to ensure that all plans which have been made are implemented rigorously and any violation is strictly punished irrespective of politics. Air pollution impacts both rich and poor and it is imperative that steps are taken urgently. Use of purifiers and masks are the last resort and these options are not available to everyone. Pollution hotspots and sources are known, numerous source apportion studies have been done. Instead of laying blame on one another, it is necessary to tackle the root cause of the problem urgently for the sake of everyone so that air quality improves all year round.
Below is a brief representation of data captured by portable devices installed in multiple locations in Korba and Delhi. The analysis has been done for two reporting periods – 1 October to 31 October 2023 and Jan 2022 to October 2023.
Section 1 – Data Analysis for period Jan 2022 to October 2023
| Monthly Average AQI – Different Cities | |||||||||||||
| Jan-22 | Feb-22 | Mar-22 | Apr-22 | May-22 | Jun-22 | Jul-22 | Aug-22 | Sep-22 | Oct-22 | Nov-22 | Dec-22 | ||
| Korba | 344 | 239 | 304 | 256 | 102 | 118 | 72 | 80 | 93 | 204 | 320 | 318 | |
| Delhi | 355 | 303 | 218 | 133 | 98 | 75 | 71 | 67 | 85 | 323 | 380 | 372 | |
| Ranchi | 200 | 81 | 77 | 159 | 158 | 198 | |||||||
| Monthly Average AQI – Different Cities | ||||||||||
| Jan-23 | Feb-23 | Mar-23 | Apr-23 | May-23 | Jun-23 | Jul-23 | Aug-23 | Sep-23 | Oct-23 | |
| Korba | 319 | 283 | 245 | 197 | 124 | 94 | 63 | 67 | 88 | 160 |
| Delhi | 412 | 328 | 198 | 125 | 124 | 71 | 80 | 62 | 85 | 264 |
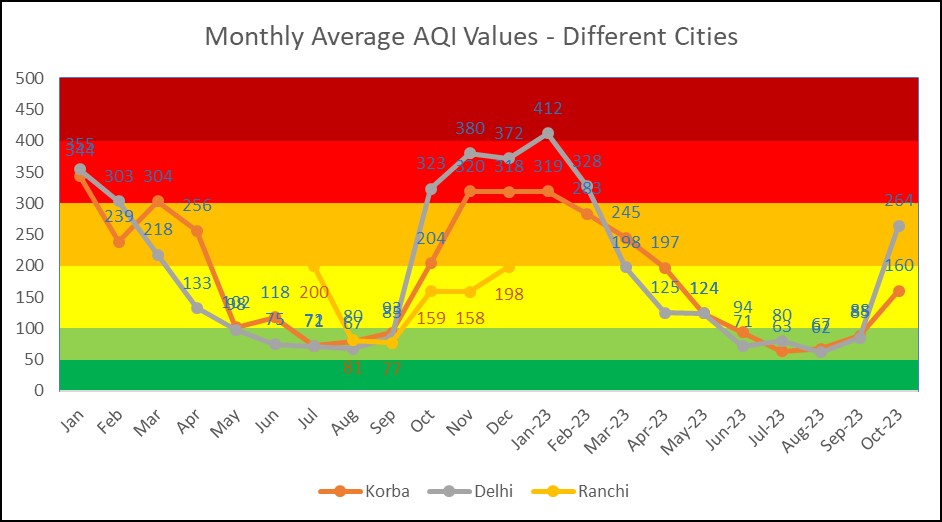
Table and Graph above show the Average Monthly AQI in different Cities. The graph and data clearly showcase the winter months when AQI comes under dangerous levels and summer and monsoon months when the air quality is Satisfactory. It is clear that AQI increases with the onset of winter and decreases as summer progresses. With the onset of monsoon, there is further improvement. This improvement in Air quality is primarily because of favourable weather conditions and not because of any mitigation aspects taken by the industries or government agencies. It is again approaching the time of the year when AQI has started going up. In Delhi, starting from the last week onwards, pollution levels have started increasing dramatically and need to be urgently watched and immediate measures taken to reduce AQI.
- During this period, Delhi recorded the worst AQI in the month of January 2023. Out of 22 months, for 14-months AQI in Delhi was above 100 while Korba had AQI above 100 for 16 months.
- October 2023 Air quality has deteriorated over the previous month figures for both Korba and Delhi.
- Air quality is poorer in Delhi as compared to Korba in October 2023
- The overall data for Korba shows that Korba Air is more polluted than Delhi for longer durations in the year.
- In comparison between October 2023 and 2022, AQI has decreased in both Delhi and Korba
- The different colour bands in the graph respond to the AQI categories as stated in the NAAQs (More later in the document)
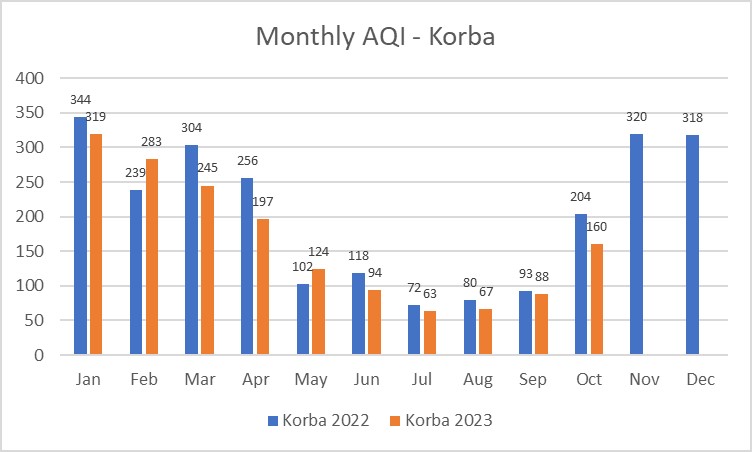
The above graph shows the monthly AQI comparison between 2022 and 2023 for Korba
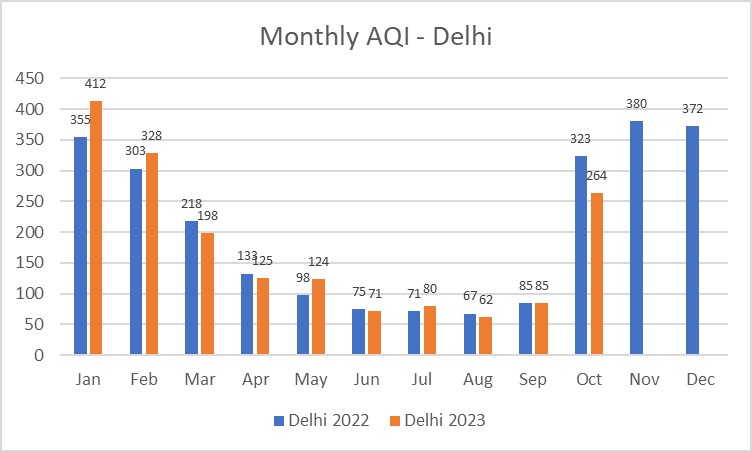
The above graph shows the monthly AQI comparison between 2022 and 2023 for Delhi
The below table shows the Monthly Average Heat Index for different cities.
| Monthly Average HI – Different Cities | |||||||||||||
| Jan-22 | Feb-22 | Mar-22 | Apr-22 | May-22 | Jun-22 | Jul-22 | Aug-22 | Sep-22 | Oct-22 | Nov-22 | Dec-22 | ||
| Korba | 19 | 24 | 29 | 36 | 40 | 39 | 37 | 35 | 35 | 30 | 23 | 21 | |
| Delhi | 17 | 20 | 26 | 32 | 35 | 36 | 39 | 37 | 36 | 28 | 24 | 18 | |
| Ranchi | 31 | 30 | 29 | 24 | 20 | 18 | |||||||
| Monthly Average HI – Different Cities | |||||||||||||
| Jan-23 | Feb-23 | Mar-23 | Apr-23 | May-23 | Jun-23 | Jul-23 | Aug-23 | Sep-23 | Oct-23 | ||||
| Korba | 21 | 24 | 29 | 32 | 35 | 40 | 39 | 35 | 34 | 30 | |||
| Delhi | 16 | 21 | 25 | 29 | 32 | 38 | 39 | 38 | 37 | 30 | |||
Particulate Matter – Paniculate matter or PM is the amount of dust particles in the air. These particles can be of different types i.e. organic, metallic etc. There are different sizes for these particles. Particles of size 10 micron are called PM 10. Those between size of 2.5 and 10 micron are called PM 2.5. those between 1 and 2.5 micron are labelled as PM1. The smaller the size of the particles, the easier for it to enter the air stream of the body and cause more impact. NAAQS and WHO (Word Health Organisation) have both set limits for amount of such particles in the air for PM 2.5 and PM 10. Below are the limits set. The Indian standard values are much higher than the WHO ADQ standard and need to be revised downwards. There are no standards yet for PM 1 which is considerably more harmful.
| PM 2.5 (ug/m3) | PM 10 (ug/m3) | |
| NAAQS (India Annual target) | 40 | 60 |
| WHO Interim target 1 | 35 | 70 |
| WHO ADQ Target | 5 | 15 |
Below is the table and graph showing Monthly Average PM 2.5 values in different cities. In only 2 month3 in both Korba and Delhi was the Indian standard met. In both Delhi and Korba, the values were more than 4 times the values in some of the months. Only during the monsoon period were the values closer to the standard but were still above. In both Delhi and Korba count of PM 2.5 particles have decreased in comparison with September 2022.
| Monthly Average PM 2.5 – Different Cities | ||||||||||||
| Jan | Feb | Mar | Apr | May | Jun | Jul | Aug | Sep | Oct | Nov | Dec | |
| Korba | 177 | 102 | 125 | 107 | 61 | 65 | 43 | 48 | 56 | 91 | 146 | 144 |
| Delhi | 191 | 124 | 95 | 70 | 59 | 45 | 43 | 40 | 51 | 150 | 224 | 214 |
| Ranchi | 90 | 48 | 46 | 78 | 77 | 89 | ||||||
| Monthly Average PM 2.5 – Different Cities | ||||||||||
| Jan-23 | Feb-23 | Mar-23 | Apr-23 | May-23 | Jun-23 | Jul-23 | Aug-23 | Sep-23 | Oct-23 | |
| Korba | 145 | 115 | 104 | 89 | 67 | 56 | 38 | 40 | 53 | 78 |
| Delhi | 266 | 156 | 89 | 68 | 67 | 43 | 48 | 37 | 51 | 109 |
Recent Comments